2025/2026 Lexington Market Review
Fairland Commons
Sale Price To List Price - 2025 UAG Date

Sale Price To List Price - 2024 UAG Date

Sale Price To List Price - 2023 UAG Date

Homes Listed

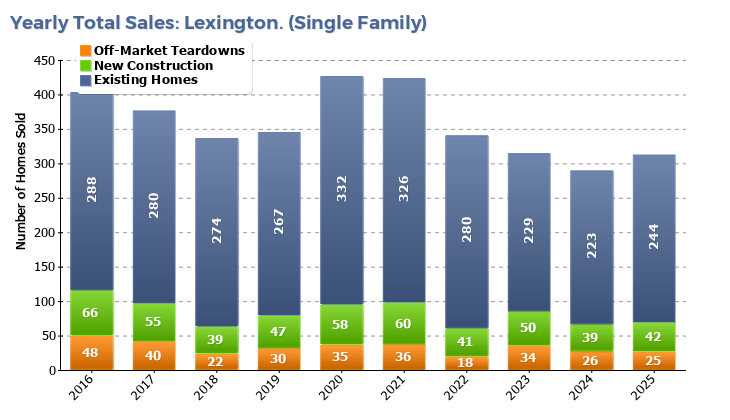
Home Sales
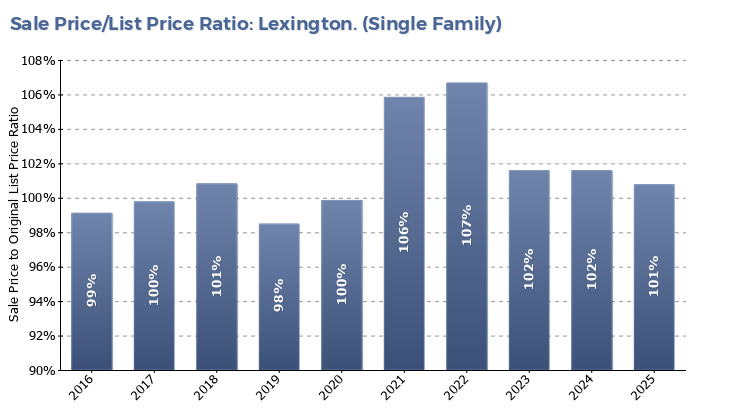
Sale Price To List Price
Sale Price To List Price - 2024 UAG Date

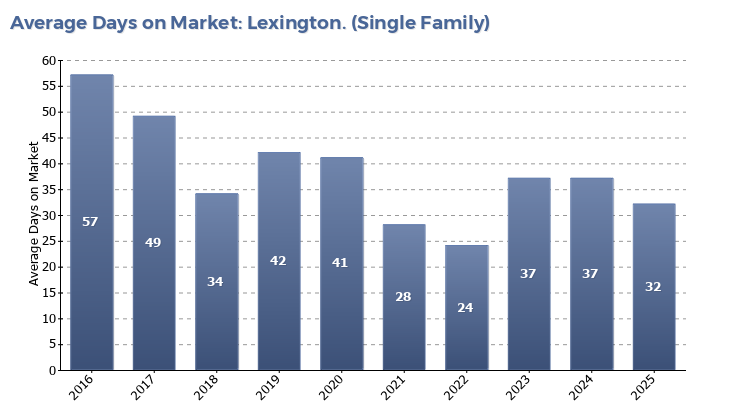
Average Days On Market
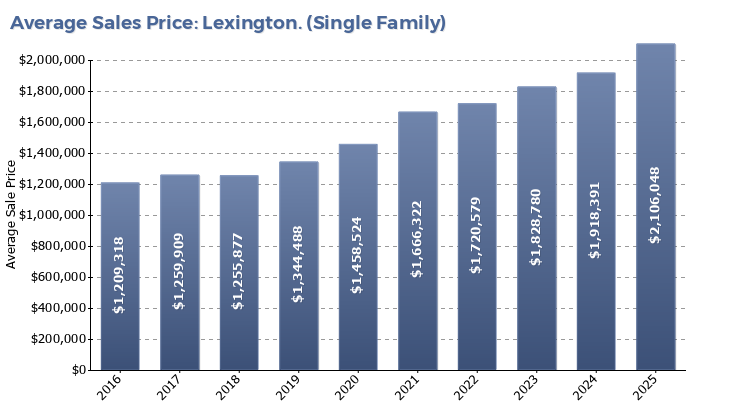
Average Sale Prices
Home Sales By Price Range
| Price Range | Average Living Area (sqft) | Average DOM | Property Sales | Average List/Sale | New Const Count | | Upto $750K | 2,008 | 8 | 1 | 99.9 | |
| $750K - $1M | 1,351 | 30 | 11 | 98.9 | |
| $1M - $1.5M | 2,150 | 21 | 67 | 104.2 | |
| $1.5M - $2M | 2,961 | 23 | 75 | 104.1 | 1 |
| $2M - $2.5M | 3,934 | 26 | 53 | 101.3 | 6 |
| $2.5M - $3M | 5,146 | 35 | 31 | 95.9 | 13 |
| $3M - $4M | 6,429 | 56 | 40 | 94.1 | 16 |
| $4M+ | 7,880 | 108 | 8 | 92.8 | 6 |
Lexington Luxury Market Summary $3M
Home Sales

Average Days On Market

Sale Price To List Price

Sale Price Distribution

Home Sales By Price Range
| Price Range | Average Living Area (sqft) | Average DOM | Property Sales | Average List/Sale | New Const Count | | $3M - $3.5M | 6,244 | 57 | 27 | 94.0 | 10 |
| $3.5M - $4M | 6,812 | 55 | 13 | 94.3 | 6 |
| $4M - $5M | 7,620 | 106 | 7 | 93.1 | 6 |
| $5M+ | 9,700 | 120 | 1 | 90.6 | |
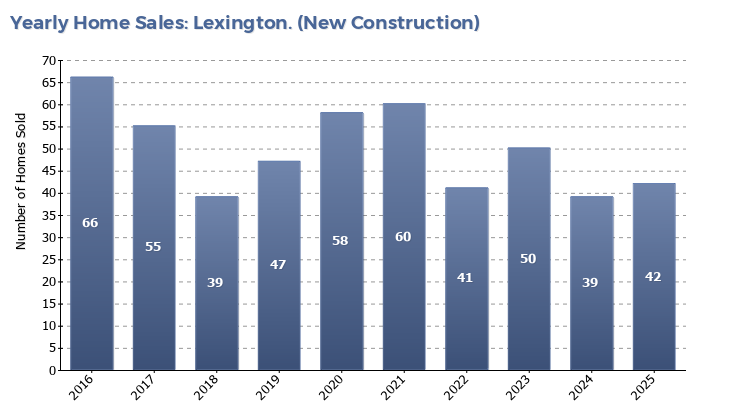
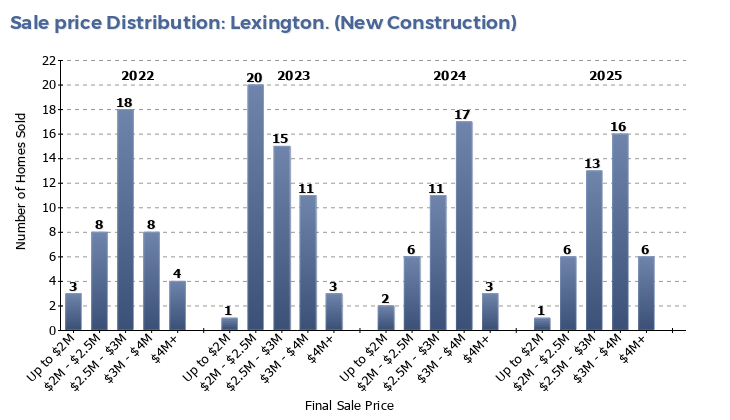
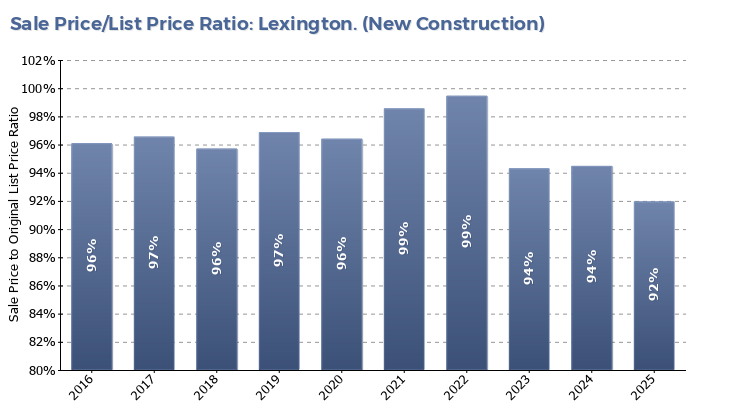
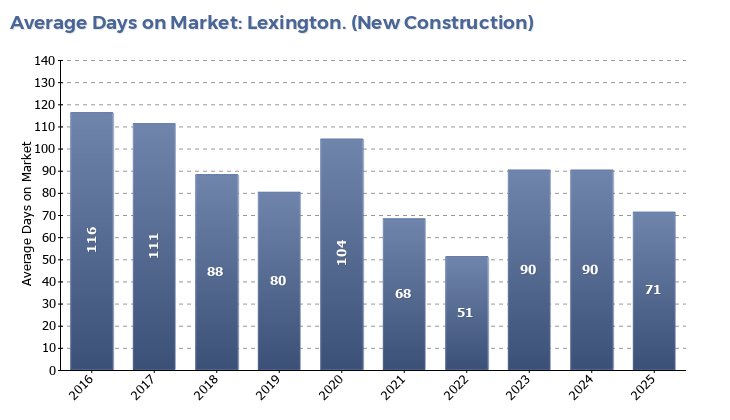
Lexington New Construction Market Summary
Home Sales
Sale Price Distribution
Sale Price To List Price
Average Days on Market
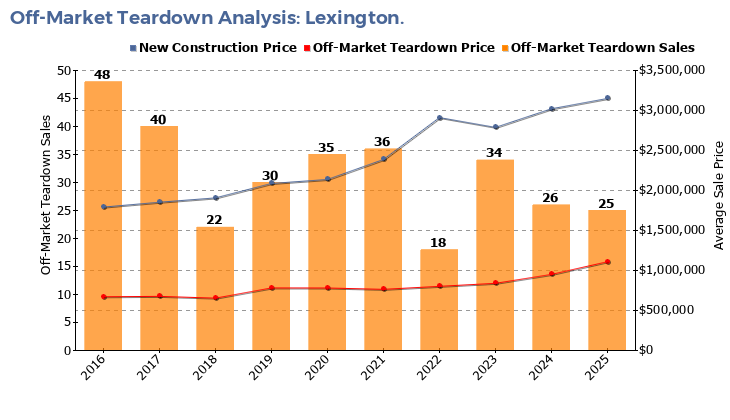
Teardown Analysis
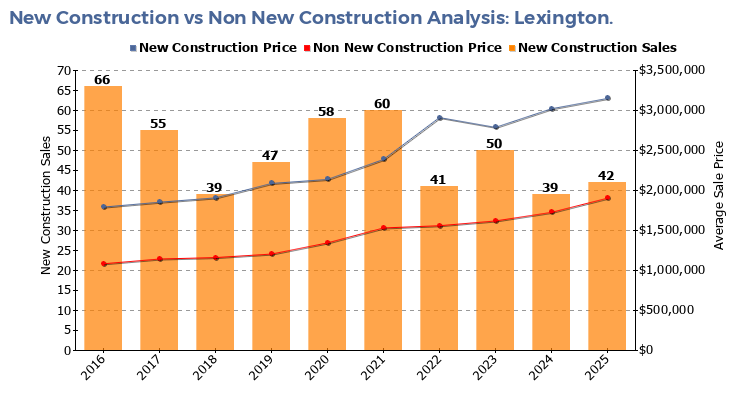
New Construction vs Non New Construction Analysis
Home Sales By Price Range
| Price Range | Average Living Area (sqft) | Average DOM | Property Sales | Average List/Sale | | $1.5M - $2M | 2,672 | 60 | 1 | 86.1 |
| $2M - $2.5M | 3,903 | 53 | 6 | 93.6 |
| $2.5M - $3M | 5,110 | 49 | 13 | 94.0 |
| $3M - $3.5M | 6,579 | 83 | 10 | 89.2 |
| $3.5M - $4M | 6,670 | 75 | 6 | 90.5 |
| $4M+ | 7,780 | 113 | 6 | 92.8 |
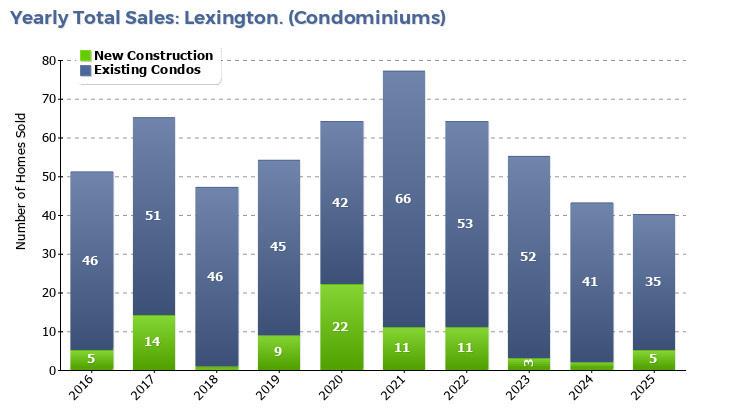
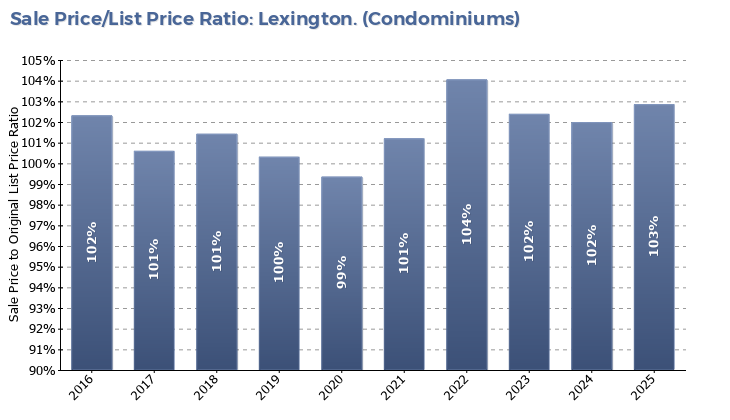
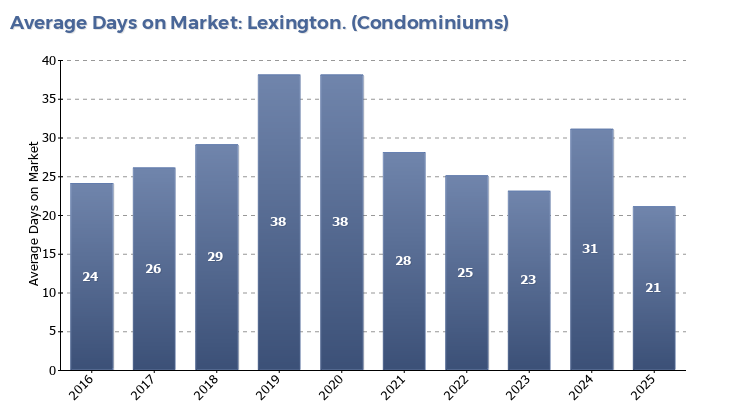
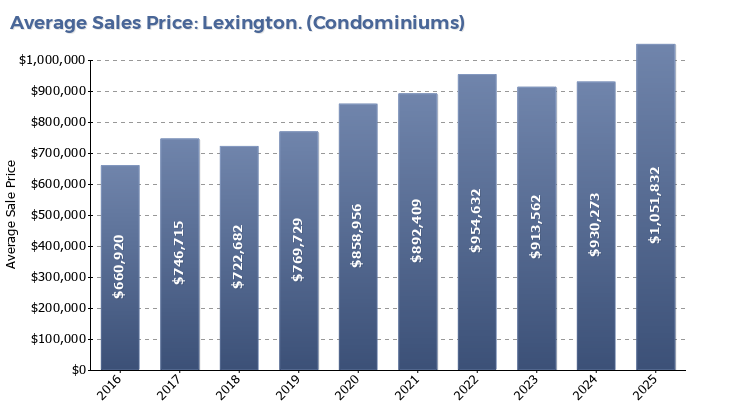
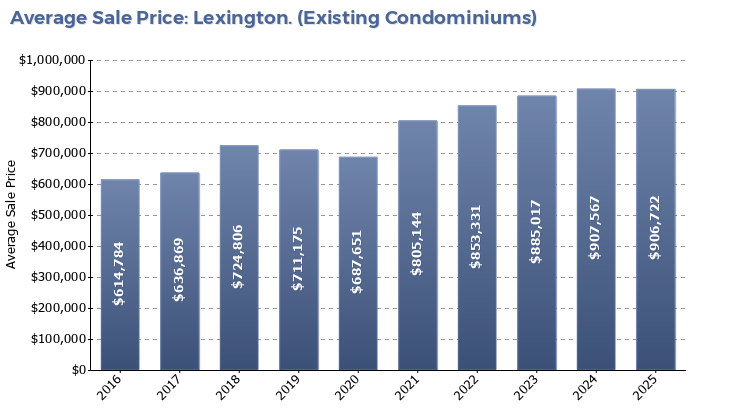
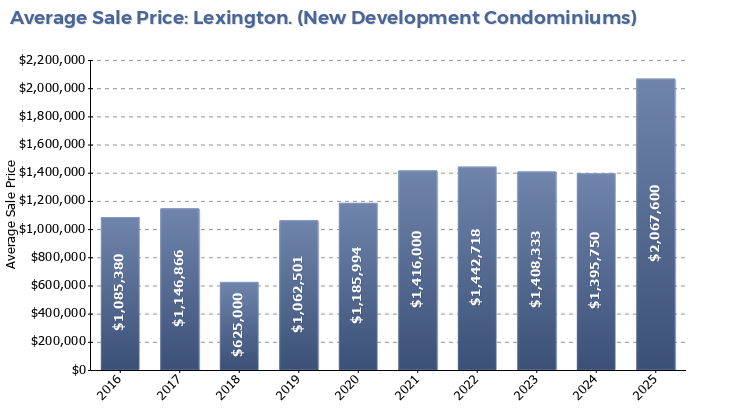
Lexington Condo Market Summary
Condominiums Listed

Condominium Sales
Sale Price To List Price
Average Days on Market
Average Sale Prices - All Condos
Average Sale Prices - Existing Condos
Average Sale Prices - New Development Condos
Lexington Housing Market Analysis and Predictions
2025 Sales Distribution

2024 Sales Distribution

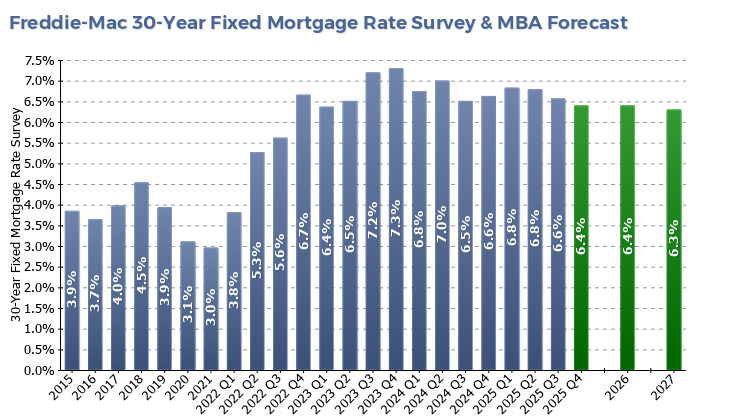
Demographic Changes And Mortgage Rate Predictions
Sale Price To List Price Ratio Distribution
